ODL.OL Odfjell Drilling
Offshore · Semisub · 52 documents
Odfjell Drilling's 5-vessel offshore fleet should earn about $485,714 a day in 2026Q3 and pay $0.25 a share. That is our forecast (PATTERN).
Yields annualise each quarter ×4 at the last close, $11.10 (2026-10-19). Our model is not company guidance.
What will Odfjell Drilling pay for 2026Q3?
Rates in, dividend out 2026Q3
Model Your scenarioSet a rate per vessel class and the statement below re-prices: our model’s figures in one column, yours beside them. These are your numbers, not our forecast and not company guidance; nothing you set is saved.
Latest rates
| Class | Company earned | Booked 2026Q3 | Market now | 8 weeks |
|---|---|---|---|---|
| Semisub · 5 | $485,7142026Q2 · fleet avg | —none printed | —no open $/day series |
Company earned: the issuer’s own reported TCE (linked). Booked: cover the issuer printed for 2026Q3. Market now: the median across the broker route prints we hold for the class — a derived blend, not a vendor index; the trend is rebased to 100 eight weeks ago.
Your rates every day is at your rate
2026Q3 P&L and cash
| Line | Model | Your scenario | Δ | ||||||||
|---|---|---|---|---|---|---|---|---|---|---|---|
Vessel-days, days modelledShips on the fleet list × the quarter's calendar days for semisub: no off-hire or drydock days are deducted there. |
460 | 460 | |||||||||
By class
| |||||||||||
| Fleet TCE, $/day assumed | 485,714 | 485,714 | |||||||||
Revenue (TCE basis), $m assumedVessel-days × fleet TCE. |
223.4 | 223.4 | |||||||||
Vessel opex, $m assumed2026Q2: $93.4m over 460 vessel-days, held per day. Source (2026Q2) |
(93.4) | (93.4) | |||||||||
G&A, $m assumed2026Q2: $2.6m over 460 vessel-days, held per day. Source (2026Q2) |
(2.6) | (2.6) | |||||||||
| EBITDA, $m assumed | 127.4 | 127.4 | |||||||||
Hire for chartered-in ships, $mNot on file for any quarter (not extracted, or not disclosed). |
— | — | |||||||||
Interest expense, $m assumed2026Q2: $18.9m over 460 vessel-days, held per day. Source (2026Q2) |
(18.9) | (18.9) | |||||||||
Scheduled debt amortisation, $m stated2026Q3: $22.1m over 460 vessel-days, held per day (the issuer’s scheduled principal). |
(22.1) | (22.1) | |||||||||
Drydock cost, $mNo separate drydock cash line on file. |
— | — | |||||||||
Cash break-even, $/day assumedΣ cash costs above ÷ vessel-days. |
297,717 | 297,717 | |||||||||
| Cushion vs fleet TCE, $/day | 187,997 | 187,997 | |||||||||
Free cash flow to equity, $m assumedRevenue − cash costs: the cash available for distribution. |
86.5 | 86.5 | |||||||||
Maintenance capex, $mNot disclosed as a cash line; not in the model’s cash. |
— | ||||||||||
Dividend policy pattern
No stated payout policy on file.
Dividend by declared rate held flat; it does not move with the rate, so your scenario leaves it unchanged.
| Output | Model | Your scenario | Δ |
|---|---|---|---|
| Estimated DPS, $/share pattern | $0.25 | ||
| Forward yield, run-rate % | 9.0% | ||
| vs last declared ($0.25, 2026Q2) | +0% |
Yield annualises the quarter’s DPS × 4 (a run-rate, not a forecast of the year) against the $11.10 close on 2026-10-19.
This dividend is set by declared rate held flat, not by the rate — your scenario moves the cash line, not the DPS.
Showing the model’s own figures. Setting your own rates needs JavaScript.
Dividend per share declared · model
Market context — rates, the dividend, and the price
Rates and dividend — realized rate and declared
Bars are the fleet TCE this issuer reported. Dashed-outline bars are the model estimate — see Dividend forecast.
The line is the declared dividend per share — dashed where it is the model's estimate. Model estimate — not issuer guidance.
Forward (our model — model quarter ×4): $1.00/yr · @ $11.10 (as of 2026-10-19) = 9.0% yield (spot-exposure scenario) · Trailing TTM $0.93/yr = 8.4%
Price and the yield it implied
Latest: 2026-Q2 declared $0.25/share on 2026-08-18, 9.9% annualised against the $10.14 close that day.
The continuous line is the daily closing price in dollars — the raw close, not a dividend-adjusted one, which would back-adjust away the very payouts being measured. The second line carries 4 declared dividends and is marked nowhere else — each annualised ×4 and divided by the close on, or last before, the day it was declared. A quarter with no dividend has no mark. The segments between the marks connect them; they are not measured. This is what the share yielded at the time, not what those dividends would yield at today's price. Prices start 2025-08-29, so anything declared before then is not plotted.
How we got the number
How to read this page
Every figure here is built the same way: the fleet's vessel-days are priced at the rate its classes earned, costs and debt service come off, and what is left is measured against the dividend the company actually declared. Nothing is estimated where it can be sourced, and a number that cannot be sourced is withheld rather than filled in. The full method, and the rates behind it →
Where ODL.OL departs from that
- No market index covers this fleet's vessel types, so each is priced at the company's own last realized rate per calendar vessel-day (revenue divided by vessel-days), held flat — the revenue track record shows how that has done.
- Weak OLS fit R²=0.30.
- Vessel-days are modelled from the fleet list (ships × days in the quarter); no issuer day count is curated for this quarter.
- Semisub: no index and no guidance — priced at the issuer's own last realized fleet rate $485,714/day (2026Q2, derived: revenue per vessel-day — Own Fleet USD 221m / (5 rigs x 91)), held flat (owner ruling 2026-09-26).
- DPS is the declared rate: $0.250 in each of 2 quarters (2026Q1, 2026Q2) — held flat, so it is not modelled from TCE.
What drives it — fleet TCE, 2026Q3
Earnings bridge — 2026Q2 → 2026Q3
Dividend history & forecast accuracy
Upcoming
| Quarter | Ex-date (est.) | Forecast DPS | Actual DPS |
|---|---|---|---|
| 2026Q3 E | 2026-11-12 est. | $0.25 | — |
| 2026Q4 E | 2027-03-04 est. | $0.25 | — |
| Period | DPS | Kind | Ex-date | Pay date | Source |
|---|---|---|---|---|---|
| 2026-Q2 | $0.25/share | regular | 2026-09-03 | 2026-09-17 | as of 2026-08-18 key information announcement |
| 2026-Q1 | $0.25/share | regular | 2026-05-27 | 2026-06-09 | as of 2026-05-12 key information announcement |
| 2025-Q4 | $0.23/share | regular | 2026-03-04 | 2026-03-19 | as of 2026-02-25 key information announcement |
| 2025-Q3 | $0.20/share | regular | 2025-11-12 | 2025-11-26 | as of 2025-11-06 key information announcement |
| 2025-Q2 | $0.18/share | regular | 2025-09-03 | 2025-09-17 | as of 2025-08-19 key information announcement |
DPS method: declared rate held flat.
Financials & fleet
Latest quarter 2026Q2
5× semisub current
Revenue model track record model vs realized
Each quarter priced at the previous quarter's realized rate, held flat — the figure the model holds once that quarter is reported — against the rate the fleet actually realized. Average miss 11.2% over 3 backtested quarters.
| Quarter | Record | Model $/day | Realized $/day | Model rev $M | Realized rev $M | Miss |
|---|---|---|---|---|---|---|
| 2025Q3 | backtest | 469,780 | 513,587 | 172.9 | 189.0 | -8.5% |
| 2026Q1 | backtest | 513,587 | 564,444 | 231.1 | 254.0 | -9.0% |
| 2026Q2 | backtest | 564,444 | 485,714 | 256.8 | 221.0 | +16.2% |
Backtest rows apply today's rule to past quarters using only the prior quarters' reported rates; live rows are the forecast as frozen on the date shown. Revenue is rate × vessel-days, so a miss here is a rate miss.
Fleet model — 2026Q3
Fleet model estimate — not issuer guidance.
| Class | Ships | TC | Spot | % Fixed | Guided $/d | Spot $/d | Blended $/d | QTD rev $M | Modeled Q rev $M |
|---|---|---|---|---|---|---|---|---|---|
| Semisub | 5 | — | — | — | — | — | 485,714 | — | 223.4 |
| Total | 5 | 485,714 | — | 223.4 | |||||
Guided rates are issuer-booked cover for 2026Q3 blended with the company's own realized rates for the open days.
Bear uses booked coverage only; Base prices open vessels at the company's own last realized fleet rate — no market index covers this fleet, so there is no peak-index Bull case.
Declared $0.25 in each of the last 2 quarters — the forward figure is the rate itself, not a TCE-linked model. No share count on file, so this rate is not checked against modelled cash.
Model gaps & assumptions
semisub: no index and no guidance — priced at the issuer's own last realized fleet rate $485,714/day (2026Q2, derived: revenue per vessel-day — Own Fleet USD 221m / (5 rigs x 91)), held flat (owner ruling 2026-09-26) · DPS is the declared rate: $0.250 in each of 2 quarters (2026Q1, 2026Q2) — held flat, so it is not modelled from TCE
Profit statement highlights
| Line | 2026Q2 | 2026Q1 | YoY Δ |
|---|---|---|---|
| Revenue | $250.6M | $284.2M | +14.5% |
| Opex | $93.4M | $132.7M | -15.9% |
| Net income | $56.5M | $73.3M | +35.5% |
reconciliation: insufficient data for an earnings bridge (2026Q2) earnings bridge incomplete — treat income-derived figures as provisional
Full P&L grid — 6 quarters
| Line item | 2026Q2 | 2026Q1 | 2025Q4 | 2025Q3 | 2025Q2 | 2025Q1 |
|---|---|---|---|---|---|---|
| Revenue $M | 250.6 | 284.2 | 244.8 | 233.7 | 218.9 | 203.9 |
| Voyage expenses $M | — | — | — | — | — | — |
| Vessel opex $M | 93.4 | 132.7 | 120.4 | 115.2 | 111.0 | 103.9 |
| G&A $M | 2.6 | — | — | — | — | — |
| Depreciation $M | — | — | — | — | — | — |
| Interest expense, gross $M | 18.9 | — | — | — | — | — |
| Net income $M | 56.5 | 73.3 | 45.4 | 55.1 | 41.7 | 30.7 |
| Declared DPS | 0.25 | 0.25 | 0.23 | 0.20 | 0.18 | 0.16 |
Realized fleet TCE
Realized fleet TCE versus benchmark: 4 points, 2025-04-01 to 2026-04-01; Realized fleet TCE latest 485,714.00.
Benchmark comparison will appear once issuer-printed benchmark data is available.
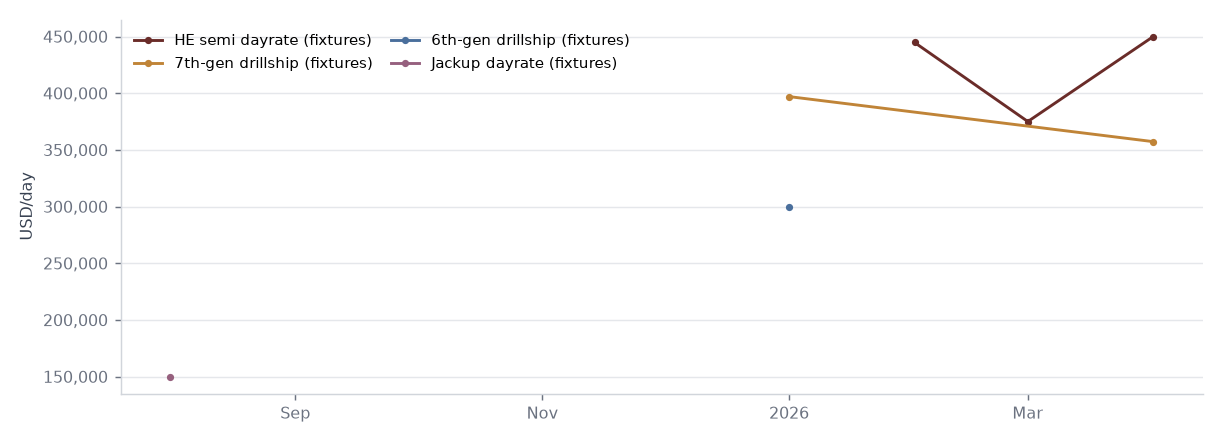
Benchmark index — monthly average
Benchmark index monthly average: 5 points, 2025-08-01 to 2026-04-01; HE semi dayrate (fixtures) latest 450,000.00; 7th-gen drillship (fixtures) latest 357,250.00; 6th-gen drillship (fixtures) latest 300,000.00; Jackup dayrate (fixtures) latest 150,000.00.
Rig fleet status
| Rig | Class | Dayrate $/day | Contracted to | Source |
|---|---|---|---|---|
| Deepsea Atlantic | semisub | — | 2027-09 | |
| Deepsea Aberdeen | semisub | — | 2029-06 | |
| Deepsea Bergen | semisub | — | 2028-03 | |
| Deepsea Stavanger | semisub | — | 2030-06 | |
| Deepsea Nordkapp | semisub | — | 2028-12 |
| Quarter | Backlog $M | Utilization |
|---|---|---|
| 2025Q1 | $1,800M | 96.0% |
| 2025Q2 | — | 92.0% |
| 2025Q3 | $1,500M | 99.0% |
| 2025Q4 | — | 98.0% |
| 2026Q1 | $2,000M | 96.0% |
| 2026Q2 | — | 97.0% |
Guidance & sources
Sources — press, filings & documents
Press & filings by quarter
Recent documents
- mfn 2026-10-16T10:35:39 Odfjell Drilling Ltd - Equinor exercises options for two additional wells for Deepsea Atlantic (2026-10-16)
- mfn 2026-09-10T07:00:00 ODL: Odfjell Drilling Ltd. Letter of Award Received from Vår Energi (2026-09-10)
- mfn 2026-09-03T08:44:22 Odfjell Drilling Ltd - Ex Dividend Q2 2026 (2026-09-03)
- mfn 2026-09-02T14:38:07 Odfjell Drilling Ltd - Favourable Administrative Tax Ruling (2026-09-02)
- mfn 2026-08-18T07:00:00 ODL: Odfjell Drilling Ltd. Reports for the Second Quarter and First Half of 2026 (2026-08-18)
- mfn 2026-08-18T07:00:00 ODL: Key Information Relating to the Cash Dividend for Second Quarter of 2026 to be paid by Odfjell Drilling Ltd. (2026-08-18)
- mfn 2026-08-12T18:33:51 Odfjell Drilling Ltd - Details for the Second Quarter and First Half of 2026 Webcast and Conference Call (2026-08-12)
- mfn 2026-08-03T07:00:56 Odfjell Drilling Ltd - Deepsea Atlantic Returns to Operations (2026-08-03)
- mfn 2026-07-17T13:51:22 ODL: Odfjell Drilling Ltd. Extension of Deepsea Nordkapp (2026-07-17)
- mfn 2026-07-06T17:15:04 Odfjell Drilling Ltd - Mandatory notification of trade by primary insider (2026-07-06)
- mfn 2026-06-19T14:46:07 Odfjell Rig III Ltd. announces listing of senior secured first lien bond on Euronext Oslo Børs (2026-06-19)
- mfn 2026-06-16T14:50:43 ODL - Minutes from the Annual General Meeting 16 June 2026 (2026-06-16)